Novacore Financial Report
+1,269%
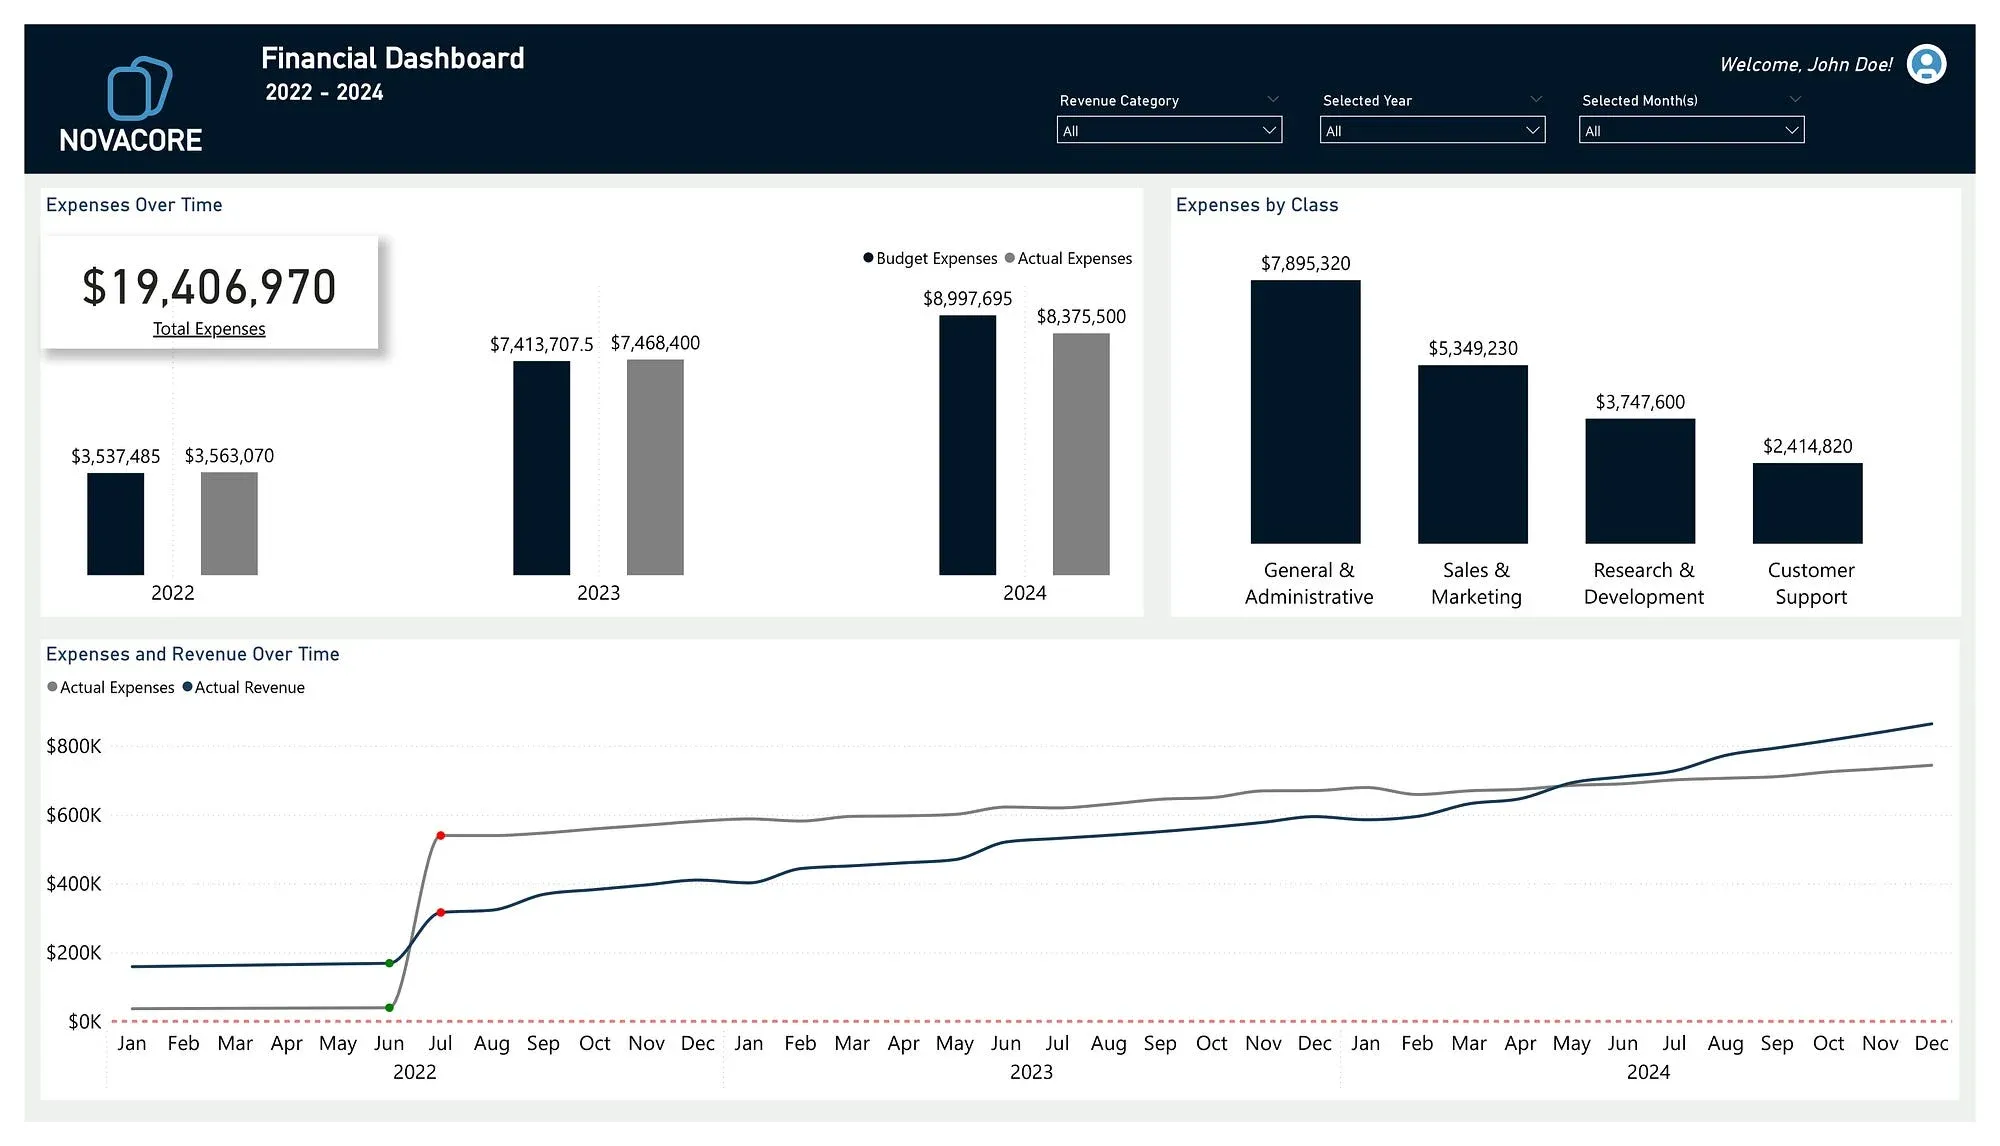
The month-on-month jump in expenses in July 2022, the month a profitable company made its first loss.
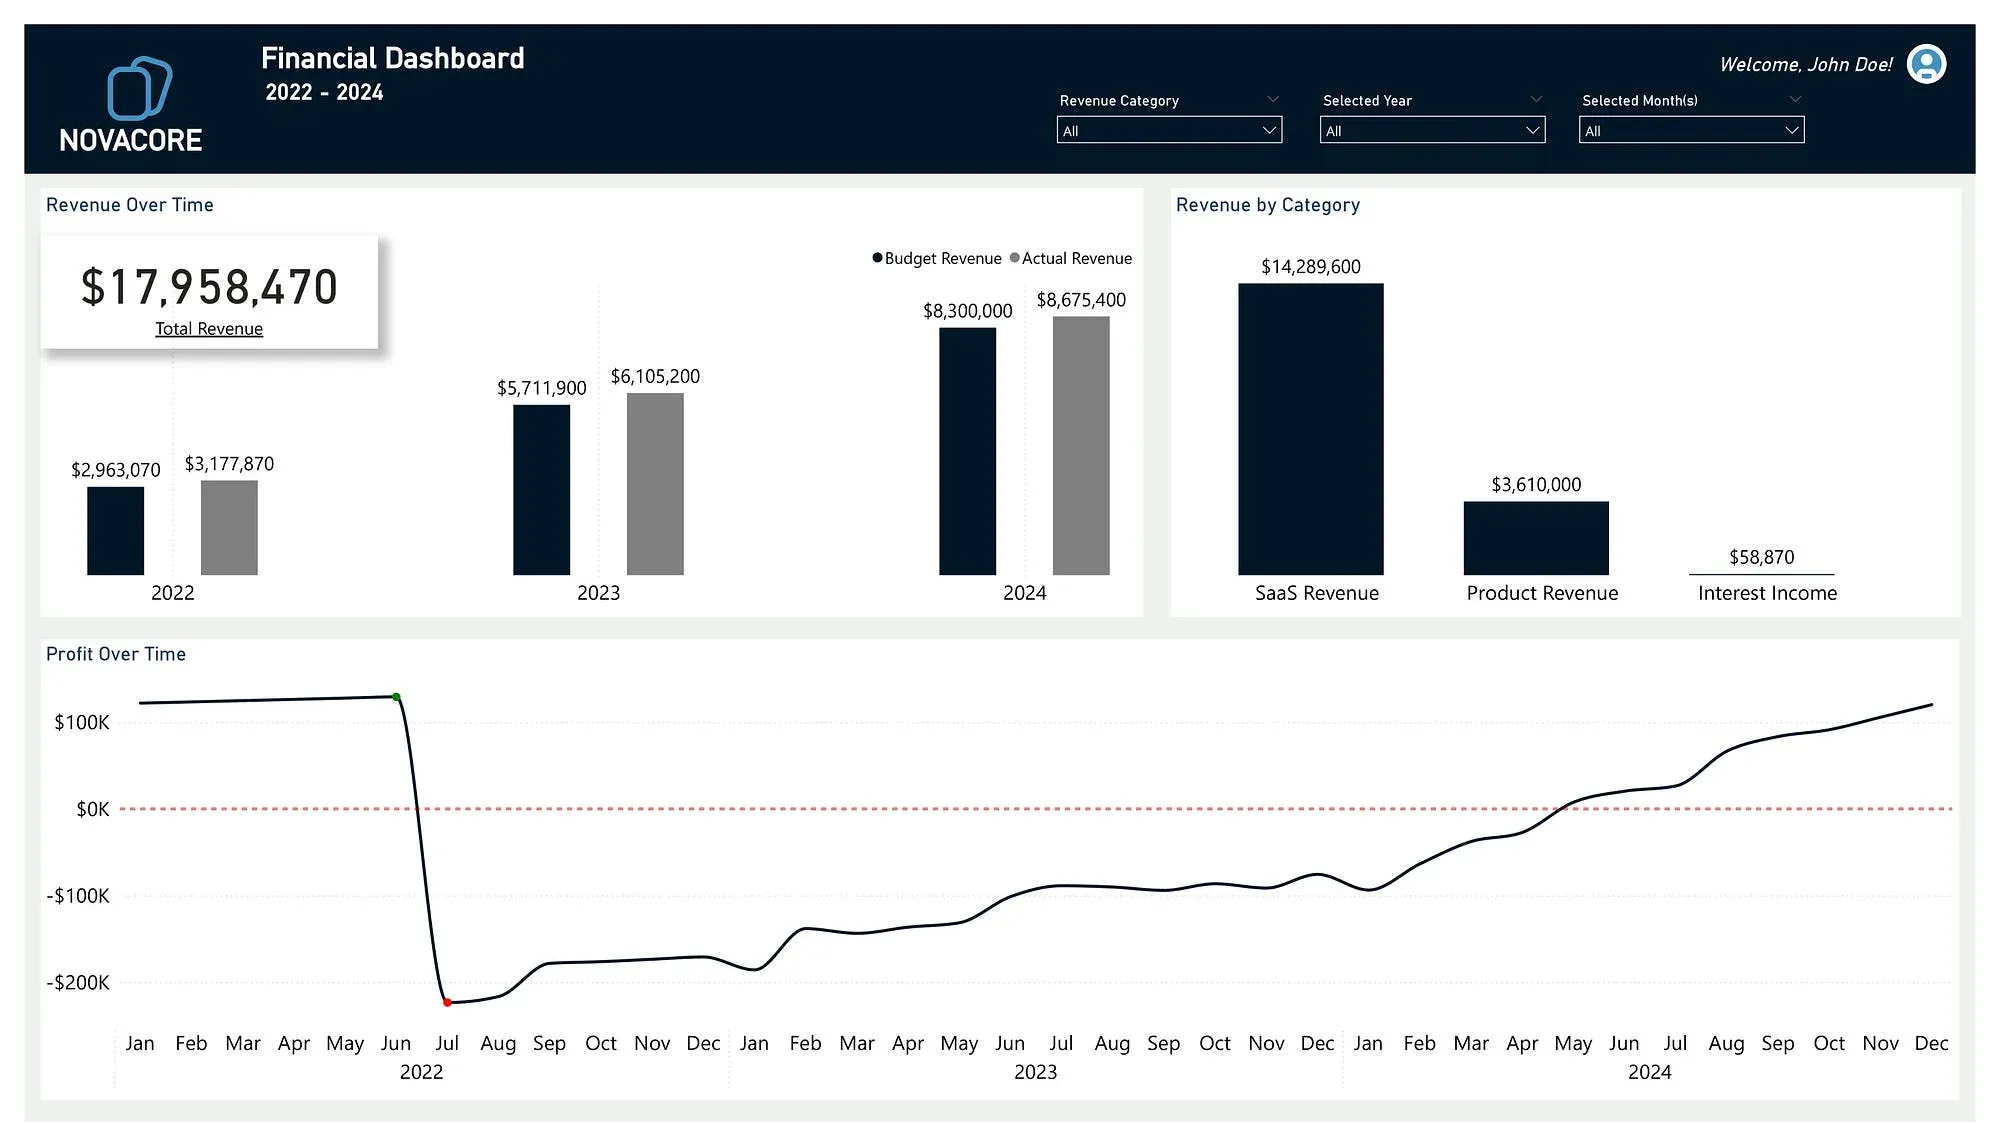
Three years of a SaaS company’s revenue, expenses and budgets, analysed in Power BI to explain a loss, show who the revenue depends on and set out a way back to profit.
The question
Novacore sells SaaS tools to businesses from startups to enterprise providers. Between 2022 and 2024 it earned $17,958,470 and beat its revenue target every year, yet it spent $19,406,970 over the same period. The report had to explain where the loss came from and how the company gets back to profit.
What happened in July 2022
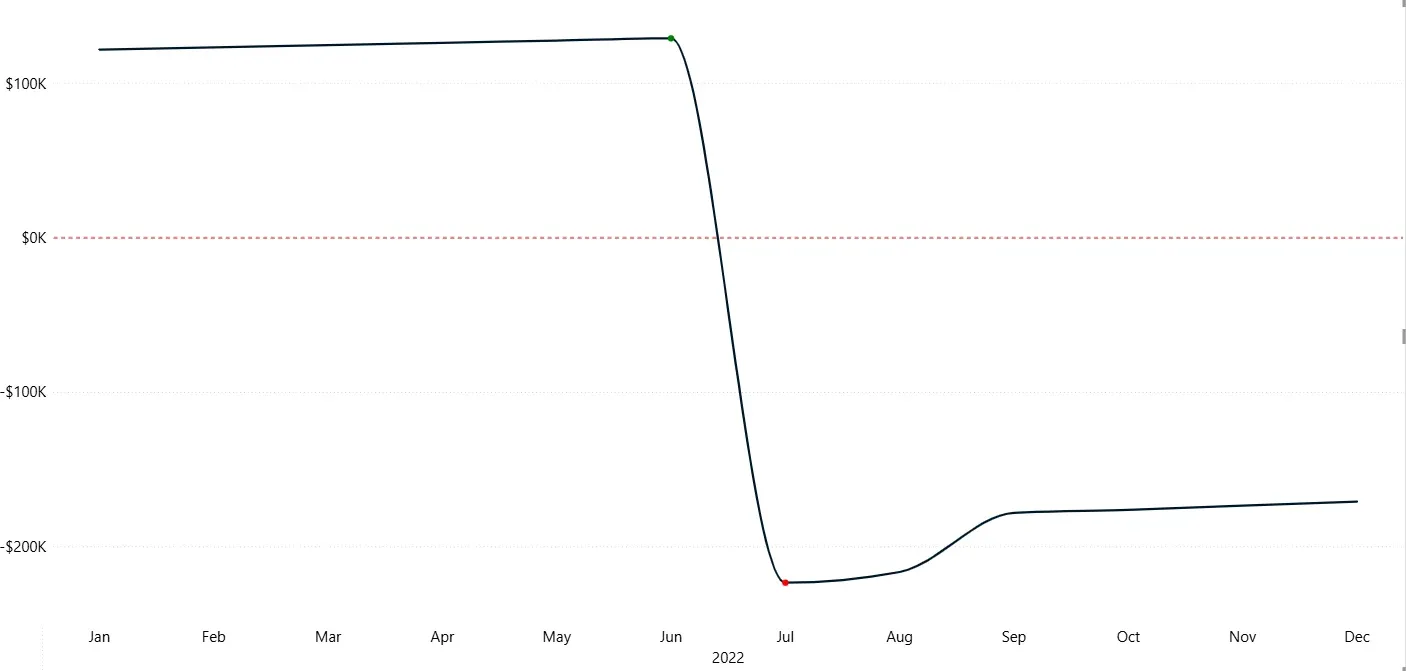
From January to June 2022 the company was comfortably profitable. In July, profit fell by 273%. Revenue was not the problem: it rose 87.39% on June. Expenses rose 1,269.37%.
Accounting, consulting, commissions, conferences and subscriptions appeared in the books for the first time that month, all at once, and existing services grew sharply in cost. Had the old cost structure held, July’s expenses would have been about $71,000. The spike lines up with the onboarding of several large clients: a deliberate expansion whose costs arrived before its revenue.
Who the revenue depends on
Four clients, Various SMB, GlobalTech, Techcop Ink and Dataflow Ltd, consistently spent above the average per transaction. In 2022 they brought in 84% of all revenue, falling to 66% by 2024 as new clients arrived. Product revenue missed its monthly target by 11% on average, and SaaS revenue and interest income quietly covered the gap.
Where the money went
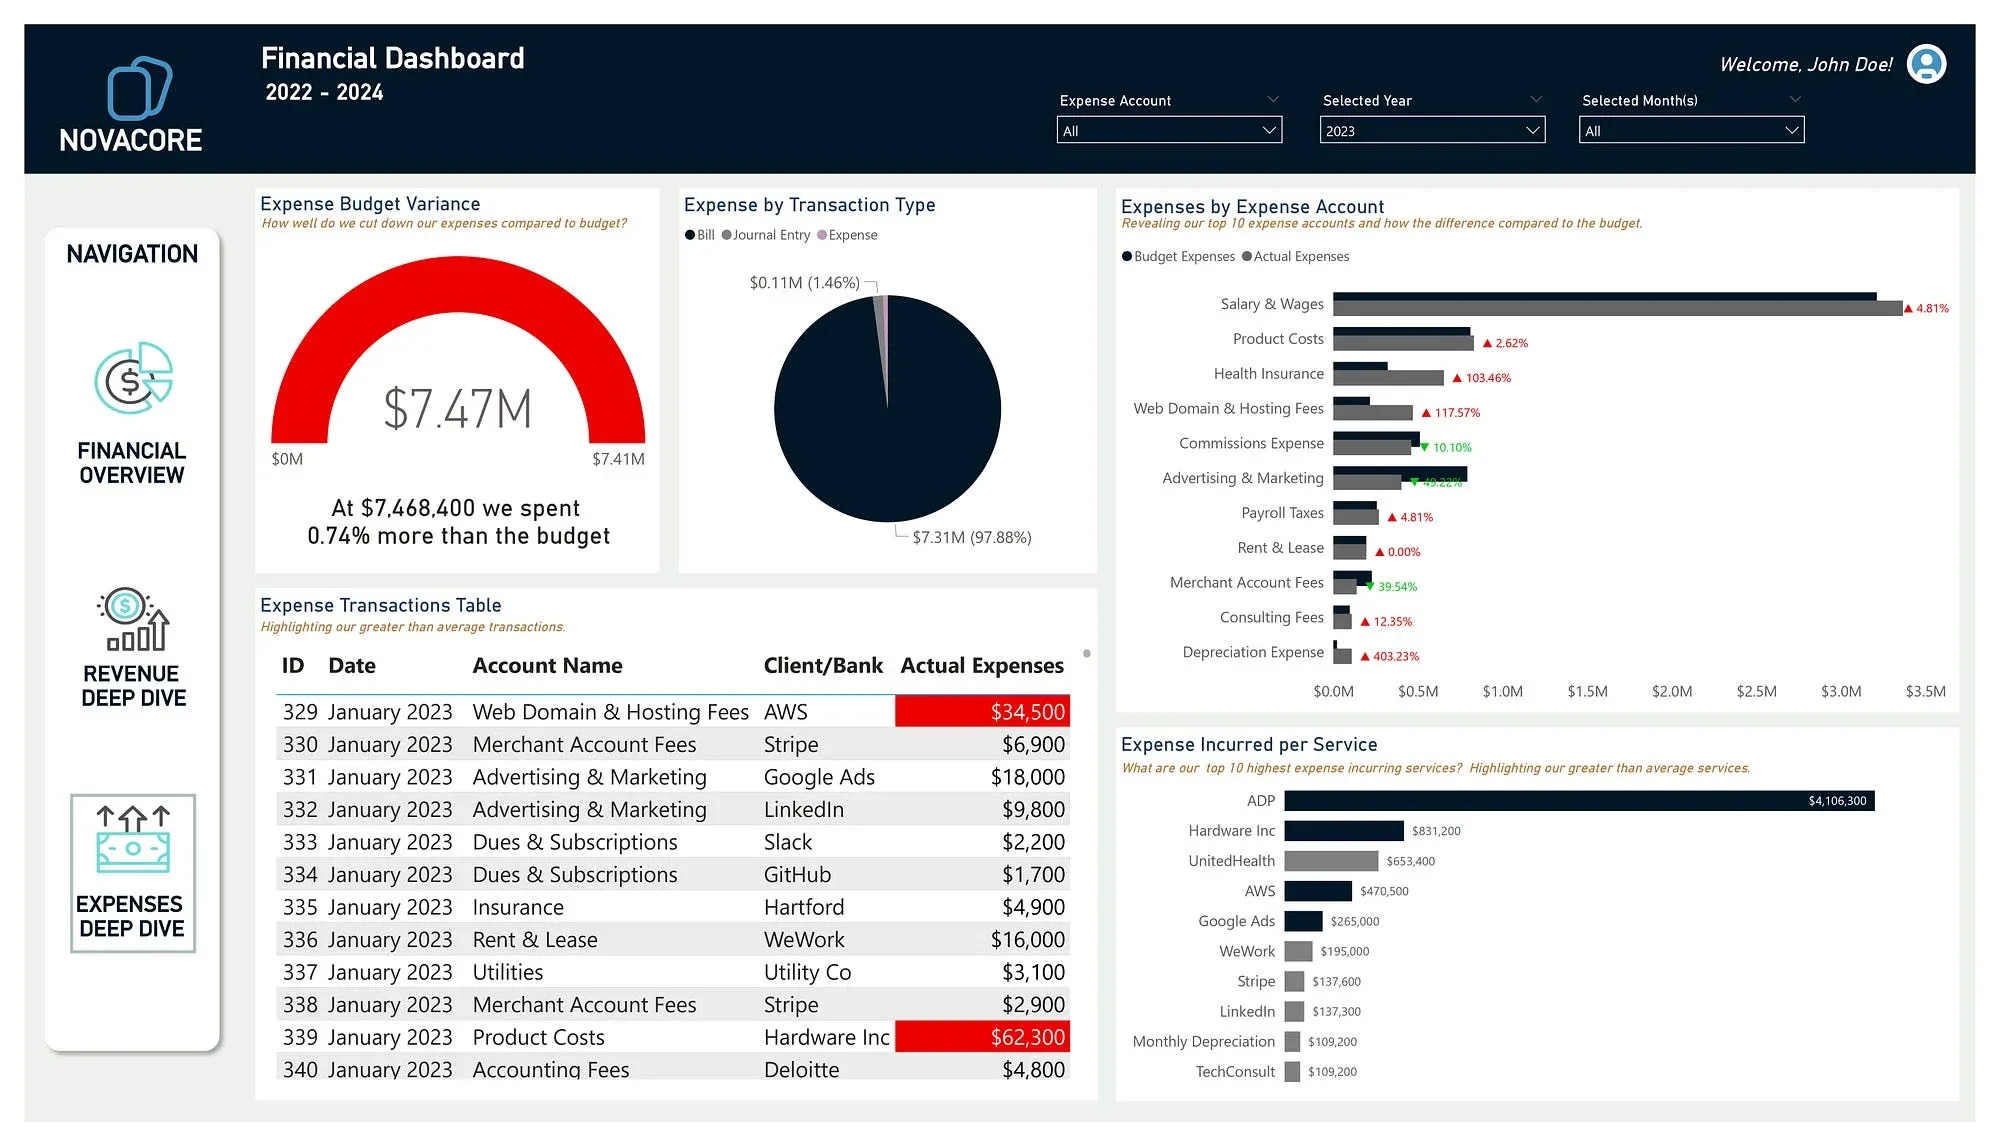
Spending ran over budget from July 2022 to July 2023, then came under control and has stayed below budget since. A few categories still stand out. Depreciation ran 332.75% over budget, web and hosting fees 97.87%, health insurance 95.40% and rent 39.18%. Advertising and marketing, by contrast, spent far less than its budget. Profit turned positive again in May 2024.
What I recommended
- Close the product revenue gap through pricing, product work or marketing.
- Audit assets and the depreciation forecast.
- Move part of the unspent marketing budget into campaigns that win new clients.
- Reduce the dependence on four clients.
- Plan budgets from actual run rates, especially in a growth year.
Data from the FP20 Analytics challenge.
The live dashboard
The report as published in Power BI. Use the arrows at its foot to move between pages.