Cyclistic Bike-Share
5.67M rides
Every trip from twelve monthly files of 2022 Divvy data, cleaned in pandas before any chart was drawn.
The Google Data Analytics capstone. A year of Chicago bike trips, cleaned and explored in Python to compare how casual riders and annual members ride.
The question
Cyclistic, a Chicago bike-share with 5,824 bikes at 692 stations, earns more from annual members than from casual riders. Marketing wants to convert casual riders into members. My part of the brief was the first question: how do the two groups use the bikes differently?
Cleaning a year of trips
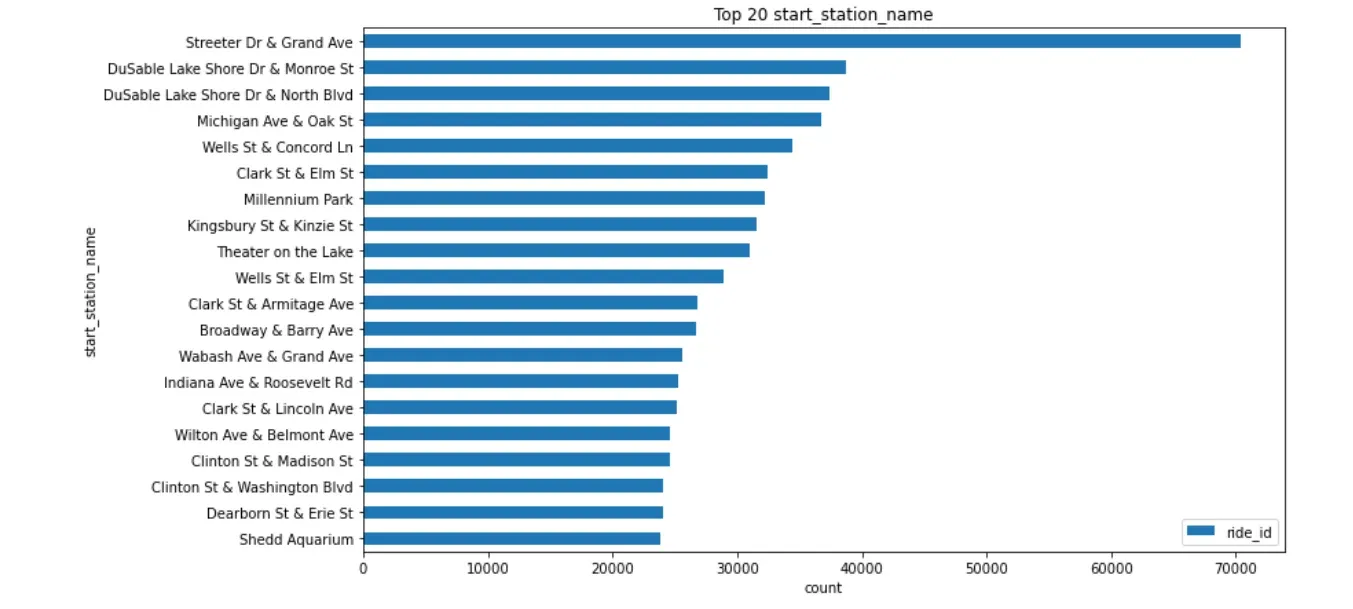
The data is twelve monthly files of 2022 trips, 5,667,717 rides in all, with 13 columns each. In pandas I combined the files, set the right types, and checked every column for gaps: 833,064 trips have no start station name and 892,742 no end station name, which matters for any station analysis. I computed each ride’s duration, removed rides with impossible durations, and added the hour, day and month of each start.
What the first pass shows
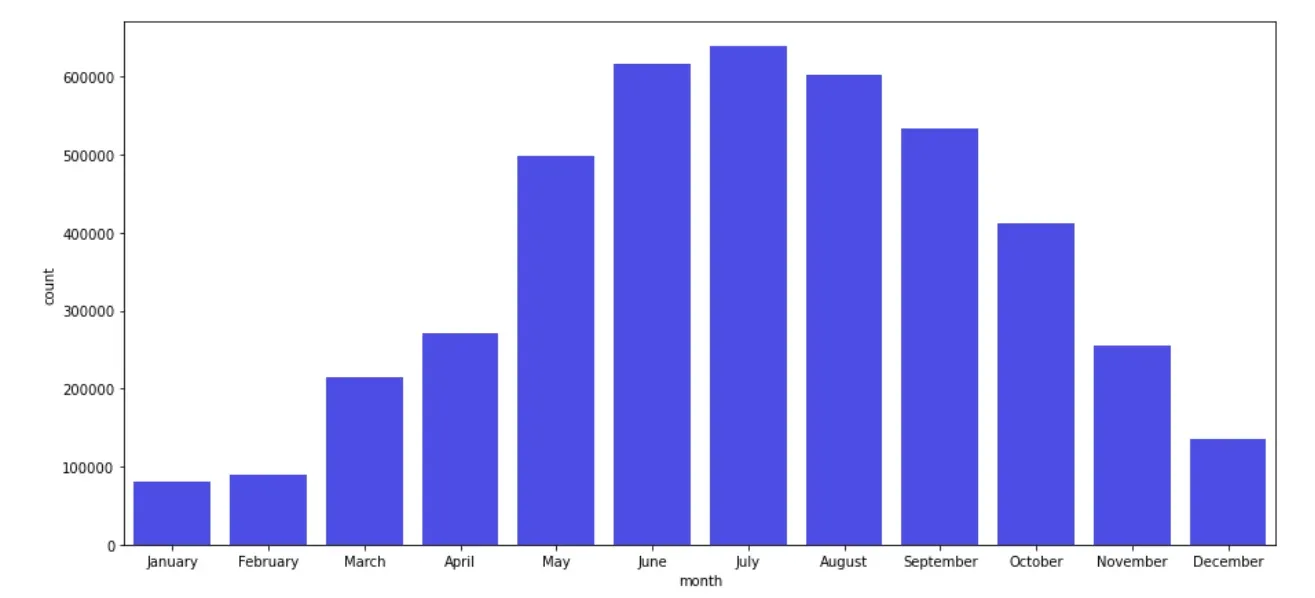
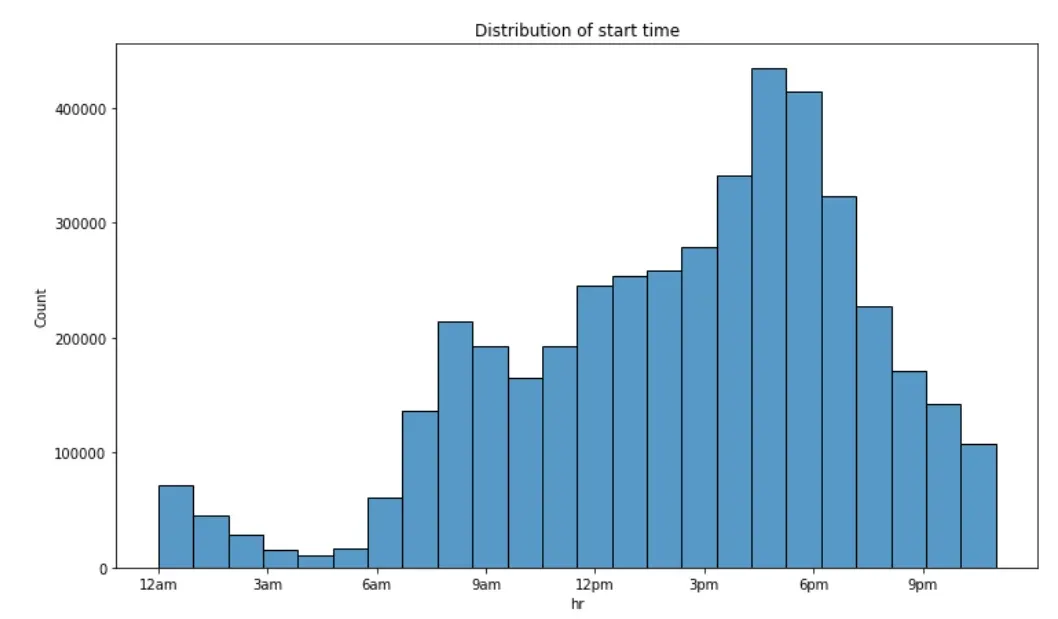
Ridership climbs from about 6 am as people commute, peaks around 6 pm, and falls away after midnight. Summer months carry the most rides. This first article covers the single-variable analysis; the comparison of casual riders against members, the statistics and the recommendations are the next part.